Title: How To Install NetData Monitoring Tool on Debian 11.3
To Install NetData Monitoring Tool on Debian 11.3
Introduction:
Netdata is a free and open-source monitoring tool that monitors various services and system performance in real-time, including CPU usage, disk activity, bandwidth usage, and more. The web-based interface allows users to easily monitor all aspects on one page.
Installation Procedure:
Step 1: Check the OS version by using the below command
root@linuxhelp:~# lsb_release -a
No LSB modules are available.
Distributor ID:	Debian
Description:	Debian GNU/Linux 11 (bullseye)
Release:	11
Codename:	bullseye
Step 2: Install Netdata by running the kickstart.sh script by using the below command
root@linuxhelp:~# bash <(curl -Ss https://my-netdata.io/kickstart.sh)

/dev/fd/63: line 35: cd: pipe:[39399]: No such file or directory

 --- Using /tmp/netdata-kickstart-7wiaHmvOrM as a temporary directory. ---
 --- Checking for existing installations of Netdata... ---
 --- No existing installations of netdata found, assuming this is a fresh install. ---
 --- Attempting to install using native packages... ---
 --- Checking for availability of repository configuration package. ---
[/tmp/netdata-kickstart-7wiaHmvOrM]# curl --fail -q -sSL --connect-timeout 10 --retry 3 --output /tmp/netdata-kickstart-7wiaHmvOrM/netdata-repo-edge_1-2_all.deb https://packagecloud.io/netdata/netdata-repoconfig/packages/debian/bullseye/netdata-repo-edge_1-2_all.deb/download.deb
 OK

[/tmp/netdata-kickstart-7wiaHmvOrM]# env apt-get update

Hit:1 http://deb.debian.org/debian bullseye InRelease

Saturday 02 July 2022 10:06:12 AM IST : INFO: netdata-updater.sh:  Auto-updating has been ENABLED through cron, updater script linked to /etc/cron.daily/netdata-updater

Saturday 02 July 2022 10:06:12 AM IST : INFO: netdata-updater.sh:  If the update process fails and you have email notifications set up correctly for cron on this system, you should receive an email notification of the failure.
Saturday 02 July 2022 10:06:12 AM IST : INFO: netdata-updater.sh:  Successful updates will not send an email.
Successfully installed the Netdata Agent.

Official documentation can be found online at https://learn.netdata.cloud/docs/.

Looking to monitor all of your infrastructure with Netdata? Check out Netdata Cloud at https://app.netdata.cloud.

Join our community and connect with us on:
  - GitHub: https://github.com/netdata/netdata/discussions
  - Discord: https://discord.gg/5ygS846fR6
  - Our community forums: https://community.netdata.cloud/
  ^
  |.-.   .-.   .-.   .-.   .-.   .  netdata                          .-.   .-
  |   '-'   '-'   '-'   '-'   '-'   is installed and running now!  -'   '-'
  +----+-----+-----+-----+-----+-----+-----+-----+-----+-----+-----+-----+--->

  enjoy real-time performance and health monitoring...

 OK
Step 3: Check the status of the Netdata service by using the below command
root@linuxhelp:~# systemctl status netdata
● netdata.service - Real time performance monitoring


     Loaded: loaded (/lib/systemd/system/netdata.service; enabled; vendor preset: enabled)
     Active: inactive (dead)
Step 4: Start the Netdata service by using the below command
root@linuxhelp:~# systemctl start netdata
Step 5: Now again Check the status of the Netdata service by using the below command
root@linuxhelp:~# systemctl status netdata
● netdata.service - Real time performance monitoring
     Loaded: loaded (/lib/systemd/system/netdata.service; enabled; vendor preset: enabled)
     Active: active (running) since Sat 2022-07-02 10:07:31 IST; 2s ago
   Main PID: 4798 (netdata)
      Tasks: 70 (limit: 6156)
     Memory: 67.4M
        CPU: 805ms
     CGroup: /system.slice/netdata.service
             ├─4798 /usr/sbin/netdata -D -P /var/run/netdata/netdata.pid
             ├─4801 /usr/sbin/netdata --special-spawn-server
             ├─4923 bash /usr/libexec/netdata/plugins.d/tc-qos-helper.sh 1
             ├─4936 sh -c /usr/libexec/netdata/plugins.d/anonymous-statistics.sh 'START' '-' '-' 'fa>
             ├─4938 /usr/libexec/netdata/plugins.d/nfacct.plugin 1
             ├─4940 /usr/libexec/netdata/plugins.d/apps.plugin 1
             ├─4941 /usr/libexec/netdata/plugins.d/ebpf.plugin 1
             ├─4942 /usr/libexec/netdata/plugins.d/go.d.plugin 1
             ├─4943 bash /usr/libexec/netdata/plugins.d/charts.d.plugin 1
             ├─4945 /usr/bin/python3 /usr/libexec/netdata/plugins.d/python.d.plugin 1
             ├─4948 sh /usr/libexec/netdata/plugins.d/anonymous-statistics.sh START - - false "dbeng>
             ├─4970 curl --silent -o /dev/null --write-out %{http_code} -X POST --max-time 2 --heade>
    "api_key": "mqkwGT0JNFqO-zX2t0mW6Tec9yooaVu7xCBlXtHnt5Y",

    "event": "START -",
    "properties": {
        "distinct_id": "b007c322-f9c0-11ec-ace9-635134e9627c",
        "$current_url": "agent backend",
        "$pathname": "netdata-backend",
        "$host": "backend.netdata.io",
        "$ip": "127.0.0.1",
        "event_source": "agent backend",
        "action": "START",
        "action_result": "-",
        "action_data": "-",
Step 6: Check the running status of the Netdata by using its default Port number
root@linuxhelp:~# netstat -tulnp | grep 19999
tcp        0      0 0.0.0.0:19999           0.0.0.0:*               LISTEN      4798/netdata
tcp6       0      0 :::19999                :::*                    LISTEN      4798/netdata
Step 7: Allow the Netdata port number 19999 on firewall by using the below command
root@linuxhelp:~# ufw allow 19999/tcp
Rule added
Rule added (v6)
Step 8: Reload the firewall by using the below command
root@linuxhelp:~# ufw reload
Firewall reloaded
Step 9: Check the status of the firewall by using the below command
root@linuxhelp:~# ufw status
Status: active
Status: active

To                         Action      From
--                         ------      ----
OpenSSH                    ALLOW       Anywhere
80                         ALLOW       Anywhere
443                        ALLOW       Anywhere
22                         ALLOW       Anywhere
19999/tcp                  ALLOW       Anywhere
OpenSSH (v6)               ALLOW       Anywhere (v6)
80 (v6)                    ALLOW       Anywhere (v6)
443 (v6)                   ALLOW       Anywhere (v6)
22 (v6)                    ALLOW       Anywhere (v6)
19999/tcp (v6)             ALLOW       Anywhere (v6)
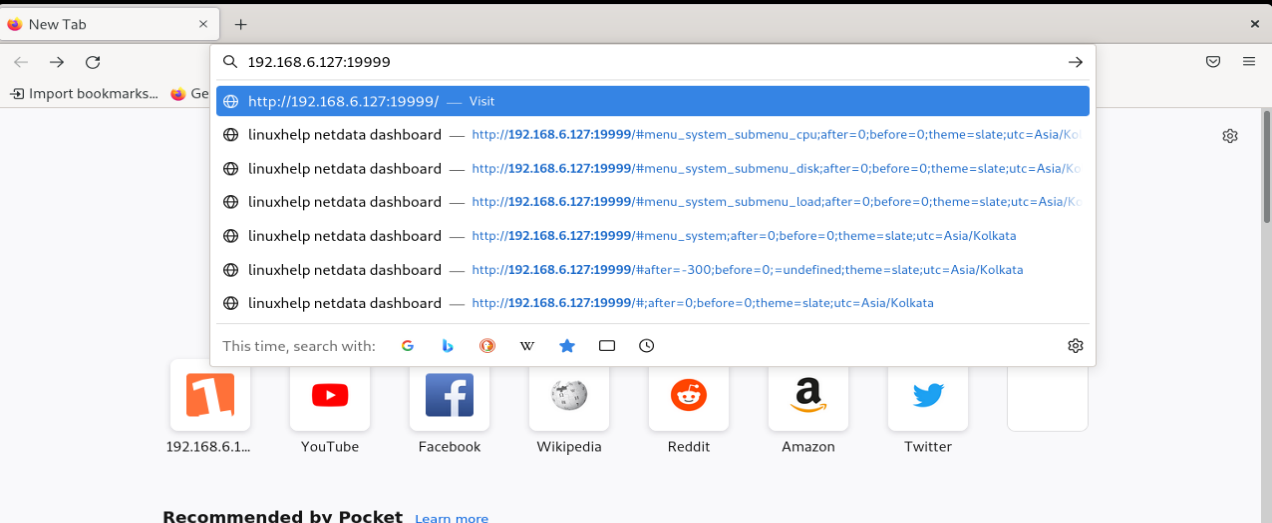
Step 10: Ping the server IP address with 19999 port number as shown in the below image
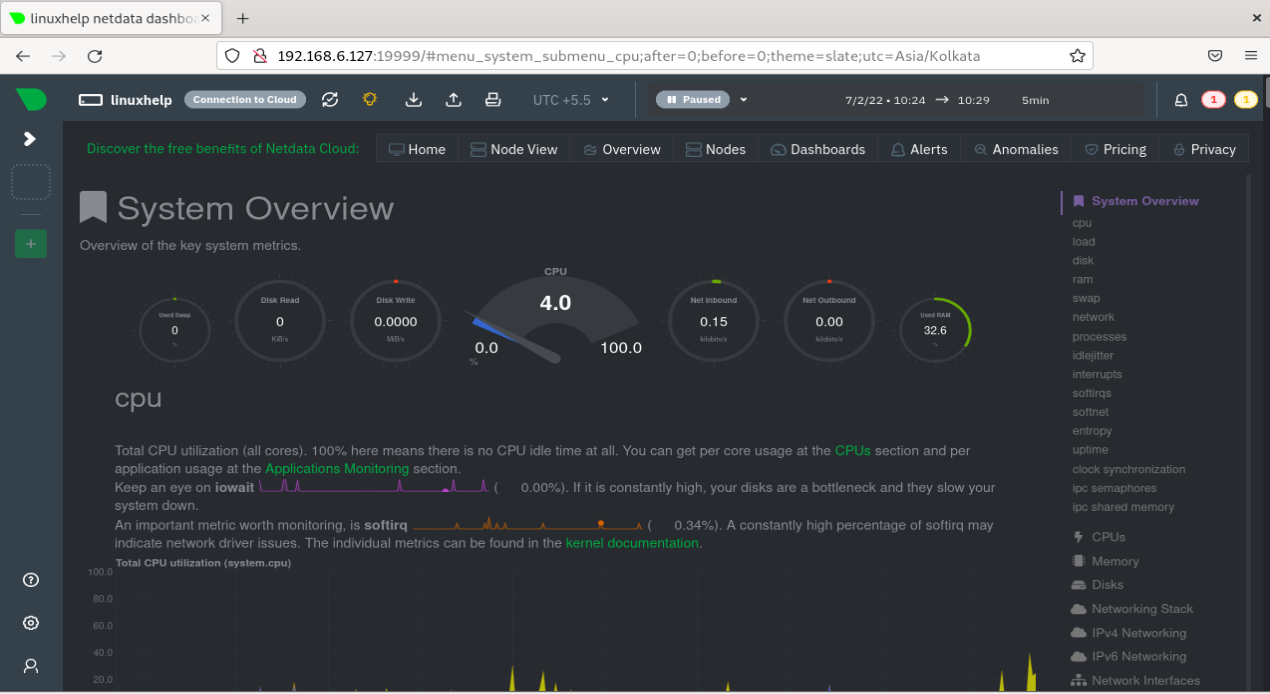
Step 11: This is the Dashboard of the Netdata
Conclusion:
We have reached the end of this article. In this guide, we have walked you through the steps required to Install Net data Monitoring Tool on Debian 11.3. Your feedback is much welcome.
Comments ( 0 )
No comments available