• Categories
    Category
    {{ postCtrl.tags }}
    • {{ category.tag_type }}

      • {{tag.tag_name}}
      • View more
  • Categories
    Category
    {{ postCtrl.tags }}
    • {{ category.tag_type }}

      • {{tag.tag_name}}
      • View more
  • News
  • Tutorials
  • Forums
  • Tags
  • Users
Tutorial News Comments FAQ Related Articles

How To Install Kibana On Centos7.6

  • 00:51 wget https://artifacts.elastic.co/downloads/kibana/kibana-7.8.0-x86_64.rpm
  • 01:10 rpm -ivh kibana-7.8.0-x86_64.rpm
  • 01:45 vim /etc/kibana/kibana.yml
  • 02:42 systemctl enable kibana
  • 02:55 systemctl start kibana
  • 03:05 netstat -ptuln | grep LISTEN
{{postValue.id}}

Installation Of Kibana On Centos7.6

Kibana is an open source data visualization and exploration tool for Elasticsearch. Log and time series analytics, application monitoring, and operational intelligence use cases can be easily done with Kibana as its neat dashboard web interface makes managing and visualizing data from Elasticsearch very smooth. This article covers the method to install Kibana on CentOS 7.6.

Installation process.

In order to install Kibana, you need a stable and latest installation package, so make sure you run the following wget command followed by its download link.

root@linuxhelp ~]# wget https://artifacts.elastic.co/downloads/kibana/kibana-7.8.0-x86_64.rpm
--2020-07-08 16:46:54--  https://artifacts.elastic.co/downloads/kibana/kibana-7.8.0-x86_64.rpm
Resolving artifacts.elastic.co (artifacts.elastic.co)... 151.101.2.222, 151.101.66.222, 151.101.130.222, ...
Connecting to artifacts.elastic.co (artifacts.elastic.co)|151.101.2.222|:443... connected.
HTTP request sent, awaiting response... 200 OK
Length: 344836026 (329M) [application/octet-stream]
Saving to: ‘kibana-7.8.0-x86_64.rpm’

100%[=============================================================>] 344,836,026 1.10MB/s   in 5m 50s 

2020-07-08 16:52:45 (961 KB/s) - ‘kibana-7.8.0-x86_64.rpm’ saved [344836026/344836026]

Once the download is completed, install the Kibana by using the following command

[root@linuxhelp ~]# rpm -ivh kibana-7.8.0-x86_64.rpm
warning: kibana-7.8.0-x86_64.rpm: Header V4 RSA/SHA512 Signature, key ID d88e42b4: NOKEY
Preparing...                          ################################# [100%]
Updating / installing...
   1:kibana-7.8.0-1                   ################################# [100%]

Next, you need to configure Kibana. So, open the Kibana configuration file.

[root@linuxhelp ~]# vim /etc/kibana/kibana.yml
server.port: 5601
server.host: " 192.168.7.228"

In order to communicate with clusters enable and provide elastic search URL

elasticsearch.url: http://192.168.7.228:9200

Once the configuration is done save and exit

Need to start and enable the kibana service by using the following command

[root@linuxhelp ~]# systemctl enable kibana
Created symlink from /etc/systemd/system/multi-user.target.wants/kibana.service to /etc/systemd/system/kibana.service.
[root@linuxhelp ~]# systemctl start kibana

Also, check if your Kibana is in LISTEN state.

[root@linuxhelp ~]# netstat -tulpn | grep LISTEN
tcp        0      0 0.0.0.0:111             0.0.0.0:*               LISTEN      1/systemd           
tcp        0      0 0.0.0.0:6000            0.0.0.0:*               LISTEN      6783/X              
tcp        0      0 192.168.122.1:53        0.0.0.0:*               LISTEN      7245/dnsmasq        
tcp        0      0 0.0.0.0:22              0.0.0.0:*               LISTEN      6734/sshd           
tcp        0      0 127.0.0.1:631           0.0.0.0:*               LISTEN      6732/cupsd          
tcp        0      0 127.0.0.1:25            0.0.0.0:*               LISTEN      7195/master         
tcp        0      0 192.168.7.228:5601      0.0.0.0:*               LISTEN      21411/node          
tcp6       0      0 :::111                  :::*                    LISTEN      1/systemd           
tcp6       0      0 192.168.7.228:9200      :::*                    LISTEN      20479/java          
tcp6       0      0 :::6000                 :::*                    LISTEN      6783/X              
tcp6       0      0 192.168.7.228:9300      :::*                    LISTEN      20479/java          
tcp6       0      0 :::22                   :::*                    LISTEN      6734/sshd           
tcp6       0      0 ::1:631                 :::*                    LISTEN      6732/cupsd          
tcp6       0      0 ::1:25                  :::*                    LISTEN      7195/master

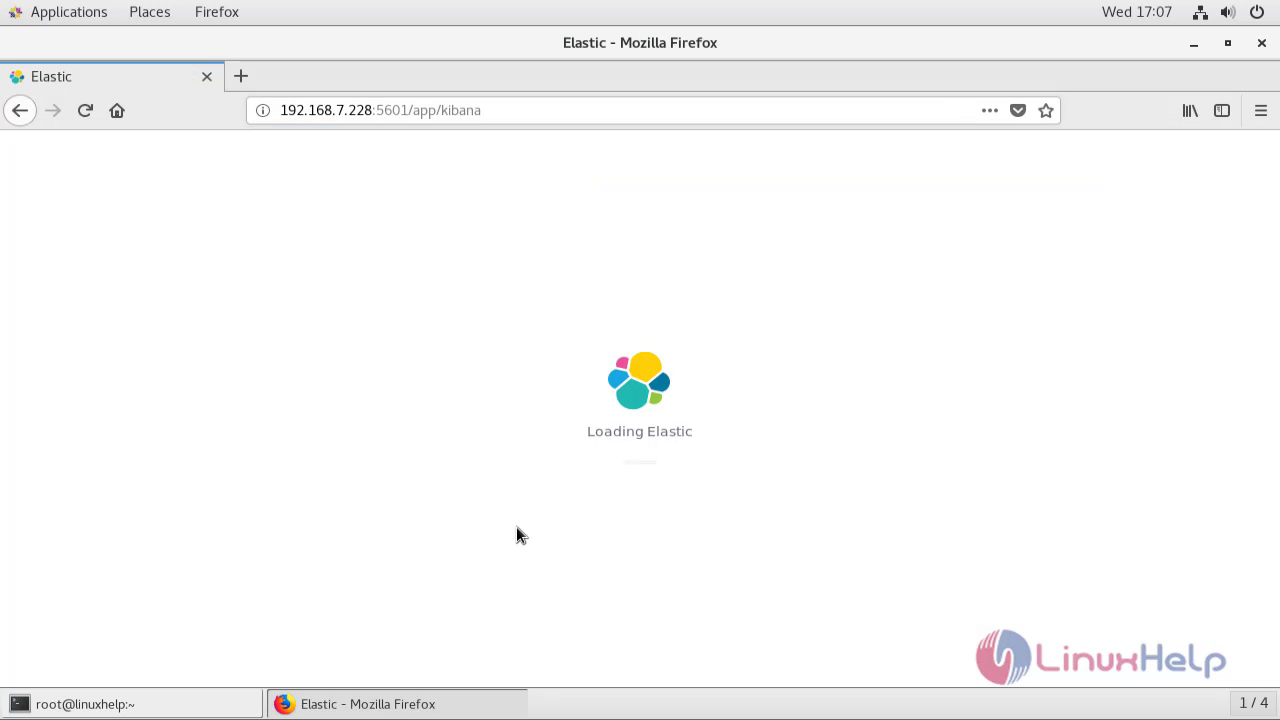
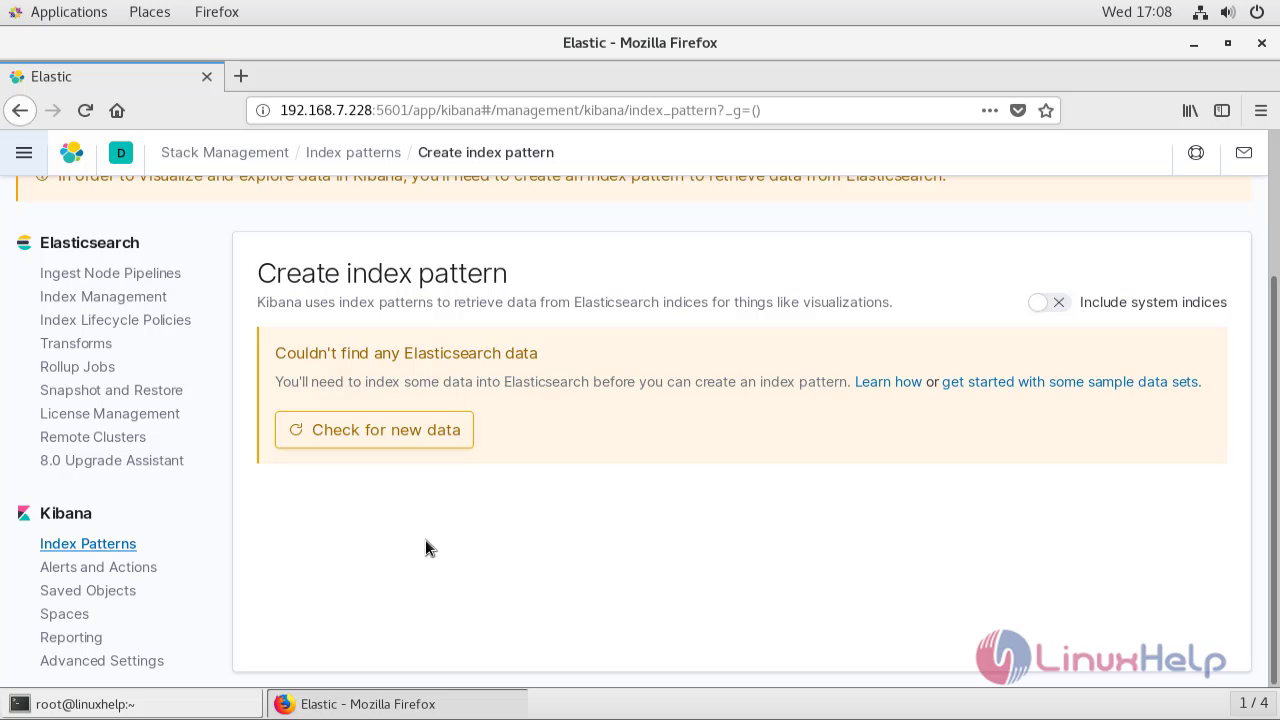
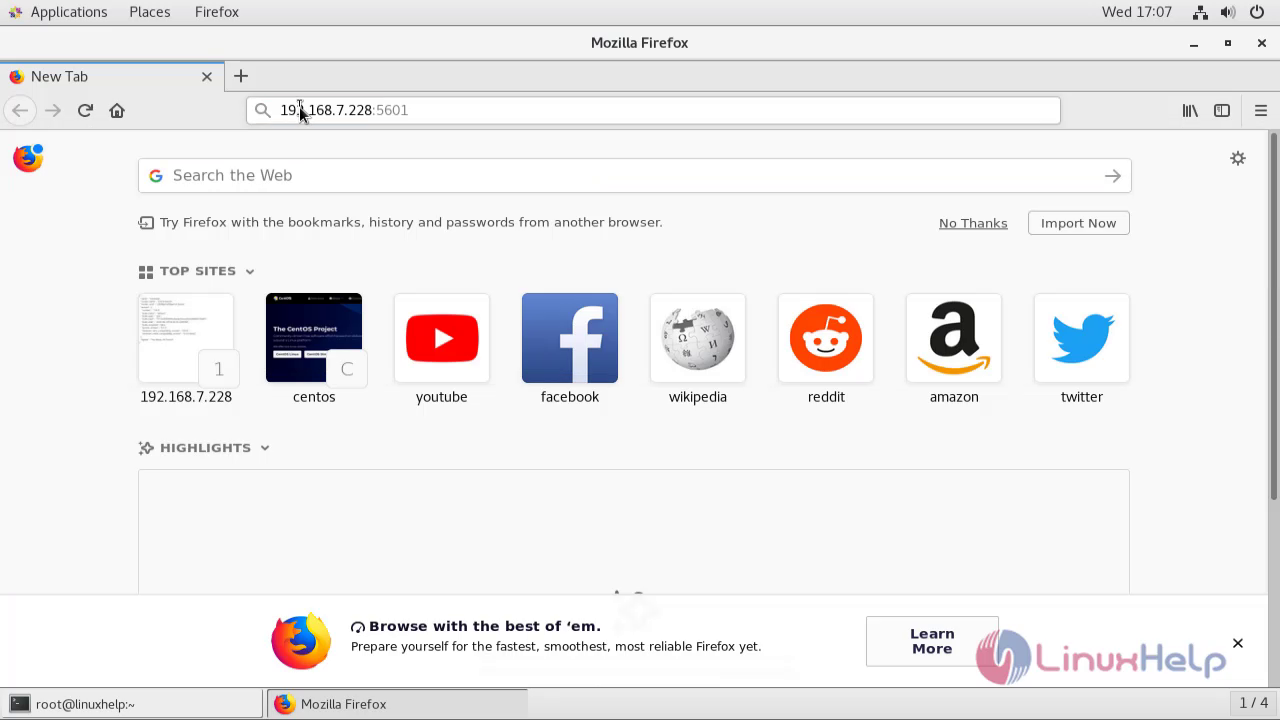
Go to the browser and enter your ip address and port number snap1 The kibana is getting loading snap2 This is the dashboard of kibana snap3
With this the install of kibana on centos 7.6 comes to end

Tags:
grayson
Author: 

Comments ( 0 )

No comments available

Add a comment
{{postCtrl.cmtErrMsg}}

Frequently asked questions ( 5 )

Q

What is use of kibana ?

A

Kibana is an open-source data visualization and exploration tool used for log and time-series analytics, application monitoring, and operational intelligence use cases. It offers powerful and easy-to-use features such as histograms, line graphs, pie charts, heat maps, and built-in geospatial support.

Q

Is the dashboard schema compatible for Kibana?

A

Unfortunately, it is not compatible. In order to create the new features we wanted, it simply was not possible to keep the same schema. Aggregations work fundamentally different from facets, the new dashboard isn’t tied to rows and columns, and the relationships between searches, visualizations and the dashboard are complex enough that we simply had to design something more flexible.

Q

What happened to templated/scripted dashboards on kibana?

A

Check out the URL. The state of each app is stored there, including any filters, queries, or columns. This should be a lot easier than constructing scripted dashboards. The encoding of the URL is RISON.

Q

Does Kibana need Elasticsearch?

A

Kibana is designed to use Elasticsearch as a data source. Think of Elasticsearch as the engine that stores and processes the data, with Kibana sitting on top. From the home page, Kibana provides these options for getting data

Q

Is kibana is paid or opensource ?

A

Kibana is an open source data visualization dashboard for Elasticsearch. It provides visualization capabilities on top of the content indexed on an Elasticsearch cluster.

Back To Top!
Rank
User
Points

Top Contributers

userNamenaveelansari
135850

Top Contributers

userNameayanbhatti
92510

Top Contributers

userNamehamzaahmed
32150

Top Contributers

1
userNamelinuxhelp
31040

Top Contributers

userNamemuhammadali
24500
Can you help Owen ?
How to add SSH key to my Gitlab account

I need to add the SSH key in my gitlab account. How to do so ????

Networking
  • Routing
  • trunk
  • Netmask
  • Packet Capture
  • domain
  • HTTP Proxy
Server Setup
  • NFS
  • KVM
  • Memory
  • Sendmail
  • WebDAV
  • LXC
Shell Commands
  • Cloud commander
  • Command line archive tools
  • last command
  • Shell
  • terminal
  • Throttle
Desktop Application
  • Linux app
  • Pithos
  • Retrospect
  • Scribe
  • TortoiseHg
  • 4Images
Monitoring Tool
  • Monit
  • Apache Server Monitoring
  • EtherApe 
  • Arpwatch Tool
  • Auditd
  • Barman
Web Application
  • Nutch
  • Amazon VPC
  • FarmWarDeployer
  • Rukovoditel
  • Mirror site
  • Chef
Contact Us | Terms of Use| Privacy Policy| Disclaimer
© 2025 LinuxHelp.com All rights reserved. Linux™ is the registered trademark of Linus Torvalds. This site is not affiliated with linus torvalds in any way.