How to Install Grafana on Ubuntu 16.04
To Install Grafana on Ubuntu 16.04
Grafana is open source data visualization and tracking suite. It supports databases such as Graphite, Elasticsearch, Included, Prometheus etc. The application has a metric analytics, with capability to control and create your own dashboard to your own apps or infrastructure performance monitoring. This article covers the method to isntall Grafana on Ubuntu 16.04.
Installing Grafana
In order to install Grafana, you need to add a repository in your source file, and for that you need to run the following command.
root@linuxhelp11:~# echo ' deb https://packagecloud.io/grafana/stable/debian/ jessie main' > /etc/apt/sources.list.d/grafana.list
And after that, you need to add the key for the newly added repository by making use of the following command.
root@linuxhelp11:~# curl https://packagecloud.io/gpg.key | sudo apt-key add -
  % Total    % Received % Xferd  Average Speed   Time    Time     Time  Current
                                 Dload  Upload   Total   Spent    Left  Speed
100  3889  100  3889    0     0   1766      0  0:00:02  0:00:02 --:--:--  1766
OK
Later, you need to update the repository by running the following command.
root@linuxhelp11:~# apt-get update
Hit:1 http://in.archive.ubuntu.com/ubuntu xenial InRelease
Hit:2 http://in.archive.ubuntu.com/ubuntu xenial-updates InRelease
Hit:3 http://security.ubuntu.com/ubuntu xenial-security InRelease
Hit:4 http://in.archive.ubuntu.com/ubuntu xenial-backports InRelease
Hit:5 https://packagecloud.io/grafana/stable/debian jessie InRelease
Reading package lists... Done
Once all the above steps are completed, you shall carry on with the installation of Grafana in the following manner.
root@linuxhelp11:~# apt-get install grafana -y
Reading package lists... Done
Building dependency tree
Reading state information... Done
The following packages were automatically installed and are no longer required:
gnome-software-common libgtkspell3-3-0
.
.
.
 sudo /bin/systemctl daemon-reload
 sudo /bin/systemctl enable grafana-server
### You can start grafana-server by executing
 sudo /bin/systemctl start grafana-server
Processing triggers for ureadahead (0.100.0-19) ...
Processing triggers for systemd (229-4ubuntu4) ...
Once it is done, you shall reload the daemon service by making use of the following command.
root@linuxhelp11:~# systemctl daemon-reload
And then, you need to enable the Grafana server by using the following command.
root@linuxhelp11:~# systemctl start grafana-server
root@linuxhelp11:~# systemctl enable grafana-server
Synchronizing state of grafana-server.service with SysV init with /lib/systemd/systemd-sysv-install...
Executing /lib/systemd/systemd-sysv-install enable grafana-server
Created symlink from /etc/systemd/system/multi-user.target.wants/grafana-server.service to /usr/lib/systemd/system/grafana-server.service.
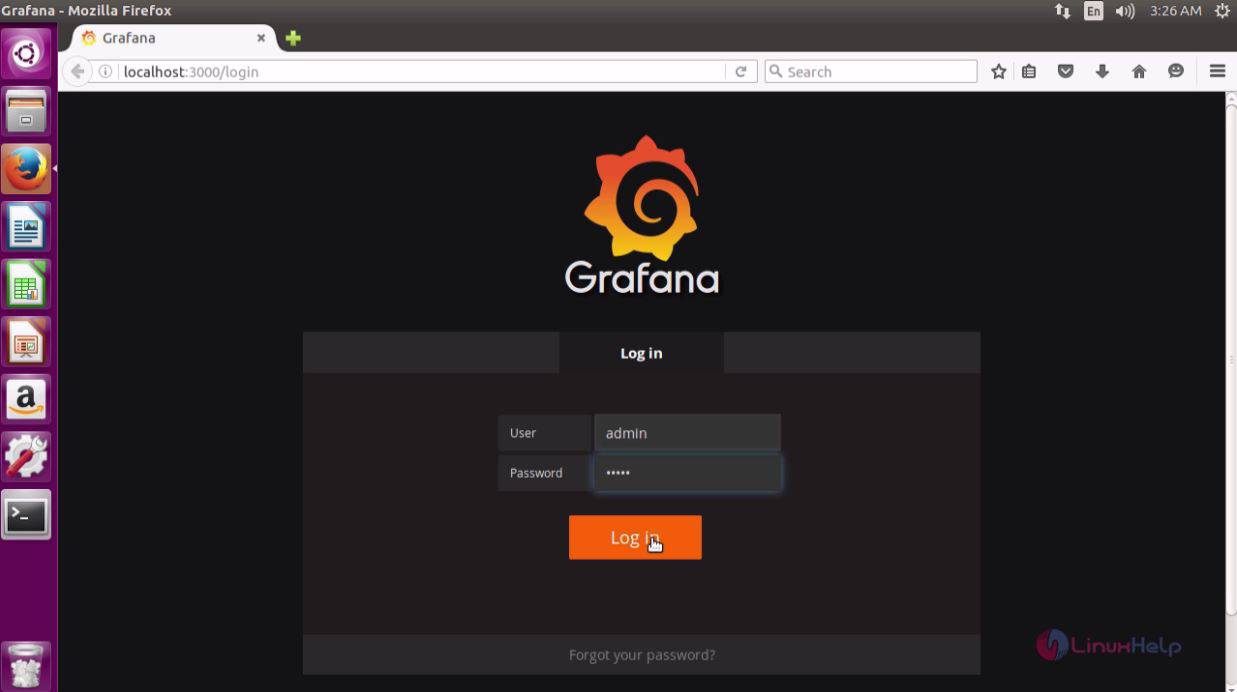
After the above step, you shall open your browser give http://localhost:3000 as your URL. The login page of Grafana appears on your screen. Enter your username and password both as admin and click the Log in button.
Once you’ ve logged in, you will be taken to the Grafana browser.
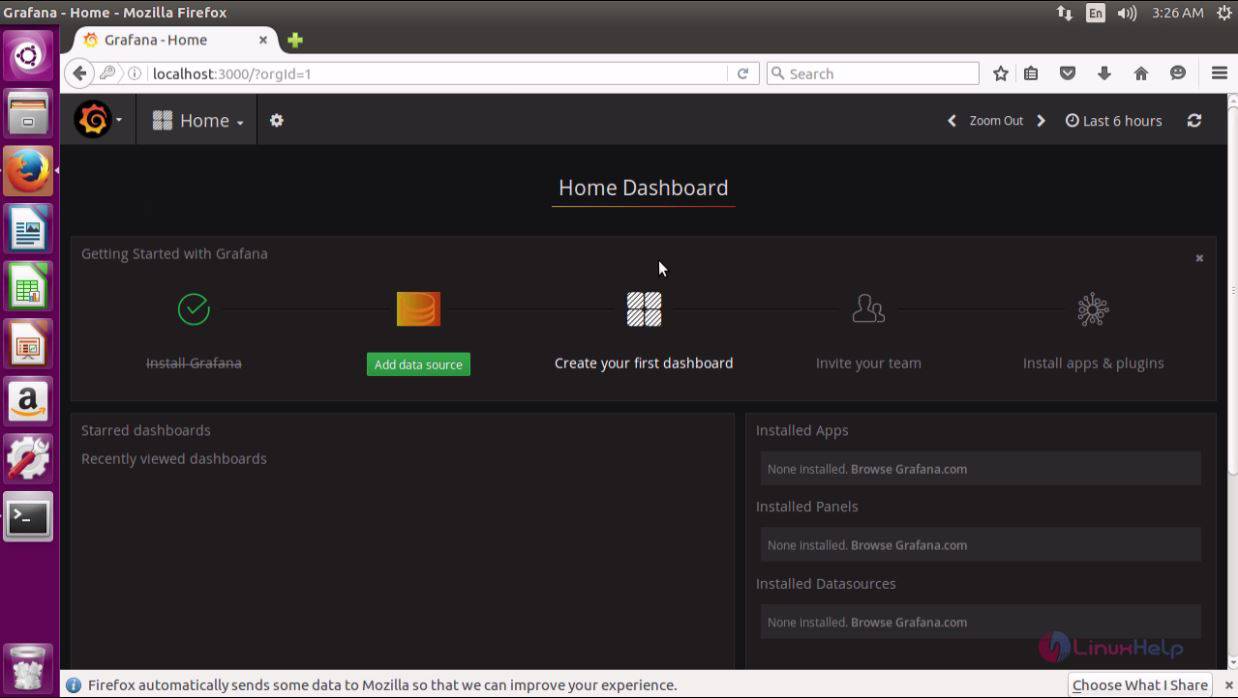
With this, the installation of Grafana comes to an end.
Comments ( 0 )
No comments available