How To Install Grafana On Centos7.6
How to Install Grafana On Centos 7.6
Grafana is open source visualization and analytic software. You can query, visualize, alert on, and explore your metric with Grafana easily. It helps you create graphs and visualizers out of your time-series database (TSDB). In this tutorial we explain about installing Grafana on CentOS 7.6
Installation process:
To install Grafana need to disable selinux
[root@linuxhelp ~]# sestatus
SELinux status:                 disabled
For installing Grafana you need to add grafana repository in yum repo. Run the following command to do the same.
[root@linuxhelp ~]# vim /etc/yum.repos.d/grafana.repo
[grafana]
name=grafana
baseurl=https://packages.grafana.com/oss/rpm
repo_gpgcheck=1
enabled=1
gpgcheck=1
gpgkey=https://packages.grafana.com/gpg.key
sslverify=1
sslcacert=/etc/pki/tls/certs/ca-bundle.crt
And then install Grafana by using the following command
[root@linuxhelp ~]# yum install grafana -y
Loaded plugins: fastestmirror, langpacks
Loading mirror speeds from cached hostfile
 * base: centos.excellmedia.net
 * extras: centos.excellmedia.net
 * updates: centos.excellmedia.net
grafana/signature                                                           |  488 B  00:00:00
Retrieving key from https://packages.grafana.com/gpg.key
Importing GPG key 0x24098CB6:
 Userid     : "Grafana <info@grafana.com>"
 Fingerprint: 4e40 ddf6 d76e 284a 4a67 80e4 8c8c 34c5 2409 8cb6
 From       : https://packages.grafana.com/gpg.key
grafana/signature                                                           | 2.9 kB  00:00:00 !!!
grafana/primary_db                                                          |  73 kB  00:00:01
Resolving Dependencies
--> Running transaction check
---> Package grafana.x86_64 0:7.1.1-1 will be installed
--> Finished Dependency Resolution
.
.
.
  Verifying  : grafana-7.1.1-1.x86_64                                                          1/1

Installed:
  grafana.x86_64 0:7.1.1-1

Complete!
Once it is done, you need to install the additional font package. Run the following command for the same.
[root@linuxhelp ~]# yum install fontconfig freetype* urw-fonts -y
Loaded plugins: fastestmirror, langpacks
Loading mirror speeds from cached hostfile
 * base: centos.excellmedia.net
 * extras: centos.excellmedia.net
 * updates: centos.excellmedia.net
Package fontconfig-2.13.0-4.3.el7.x86_64 already installed and latest version
Package freetype-2.8-14.el7.x86_64 already installed and latest version
Package urw-fonts-2.4-16.el7.noarch is obsoleted by urw-base35-fonts-20170801-10.el7.noarch which is already installed
Resolving Dependencies
--> Running transaction check
.
.
.
Installed:
  freetype-demos.x86_64 0:2.8-14.el7               freetype-devel.x86_64 0:2.8-14.el7

Dependency Installed:
  libpng-devel.x86_64 2:1.5.13-7.el7_2               zlib-devel.x86_64 0:1.2.7-18.el7

Complete!
And then reload the daemon service with the below mentioned command.
[root@linuxhelp ~]# systemctl daemon-reload
Start the Grafana service
[root@linuxhelp ~]# systemctl start grafana-server.service
Check the status of Grafana as follows.
[root@linuxhelp ~]# systemctl status grafana-server.service
● grafana-server.service - Grafana instance
   Loaded: loaded (/usr/lib/systemd/system/grafana-server.service; disabled; vendor preset: disabled)
   Active: active (running) since Tue 2020-07-28 15:36:53 IST; 23s ago
     Docs: http://docs.grafana.org
 Main PID: 56932 (grafana-server)
    Tasks: 8
   CGroup: /system.slice/grafana-server.service
           └─56932 /usr/sbin/grafana-server --config=/etc/grafana/grafana.ini --pidfile=/var/run...

Jul 28 15:36:53 linuxhelp grafana-server[56932]: t=2020-07-28T15:36:53+0530 lvl=info msg="Exec...n"
Jul 28 15:36:53 linuxhelp grafana-server[56932]: t=2020-07-28T15:36:53+0530 lvl=info msg="Exec...n"
Jul 28 15:36:53 linuxhelp grafana-server[56932]: t=2020-07-28T15:36:53+0530 lvl=info msg="Exec...e"
Jul 28 15:36:53 linuxhelp grafana-server[56932]: t=2020-07-28T15:36:53+0530 lvl=info msg="Exec...y"
Jul 28 15:36:53 linuxhelp grafana-server[56932]: t=2020-07-28T15:36:53+0530 lvl=info msg="Crea...in
Jul 28 15:36:53 linuxhelp grafana-server[56932]: t=2020-07-28T15:36:53+0530 lvl=info msg="Star...ns
Jul 28 15:36:53 linuxhelp grafana-server[56932]: t=2020-07-28T15:36:53+0530 lvl=info msg="Regi...t"
Jul 28 15:36:53 linuxhelp grafana-server[56932]: t=2020-07-28T15:36:53+0530 lvl=info msg="Exte...ns
Jul 28 15:36:53 linuxhelp systemd[1]: Started Grafana instance.
Jul 28 15:36:53 linuxhelp grafana-server[56932]: t=2020-07-28T15:36:53+0530 lvl=info msg="HTTP...t=
Hint: Some lines were ellipsized, use -l to show in full.
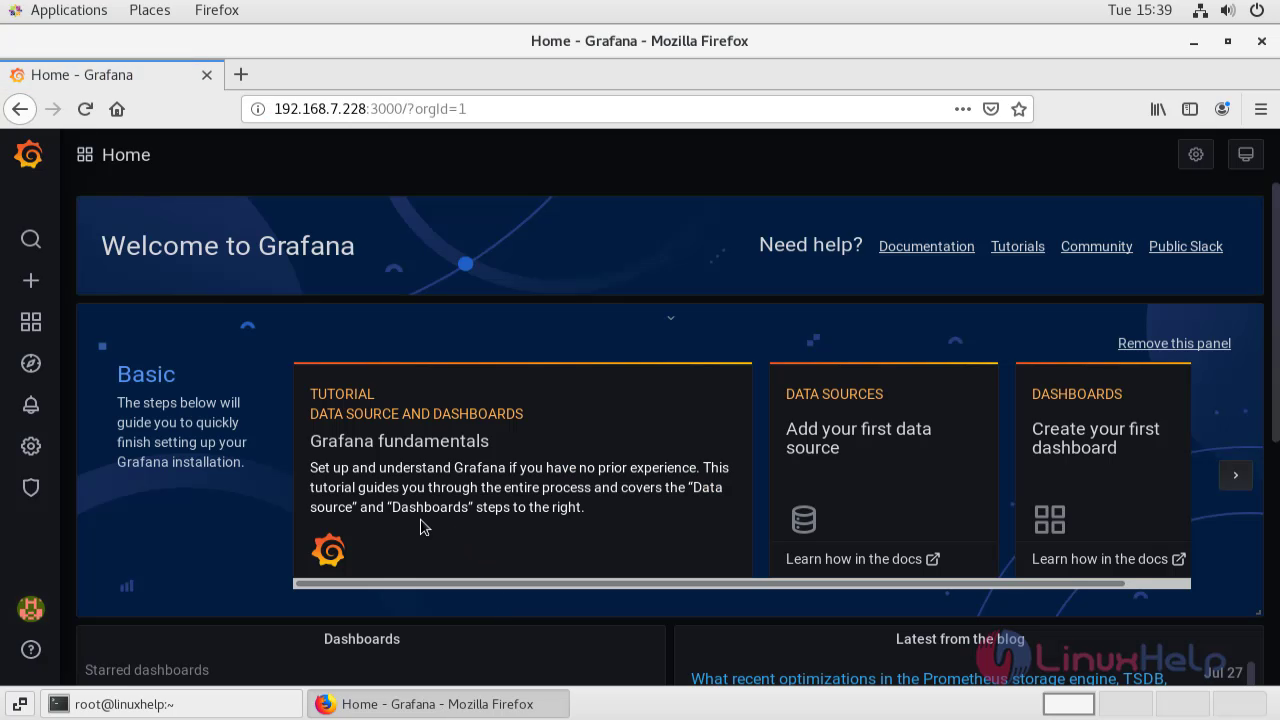
Once the above procedure is completed, go to browser and enter the IP address and port number.
 This is the welcome page of Grafana. The default username is admin, password: admin
 Change new password
 This is the dashboard of Grafana
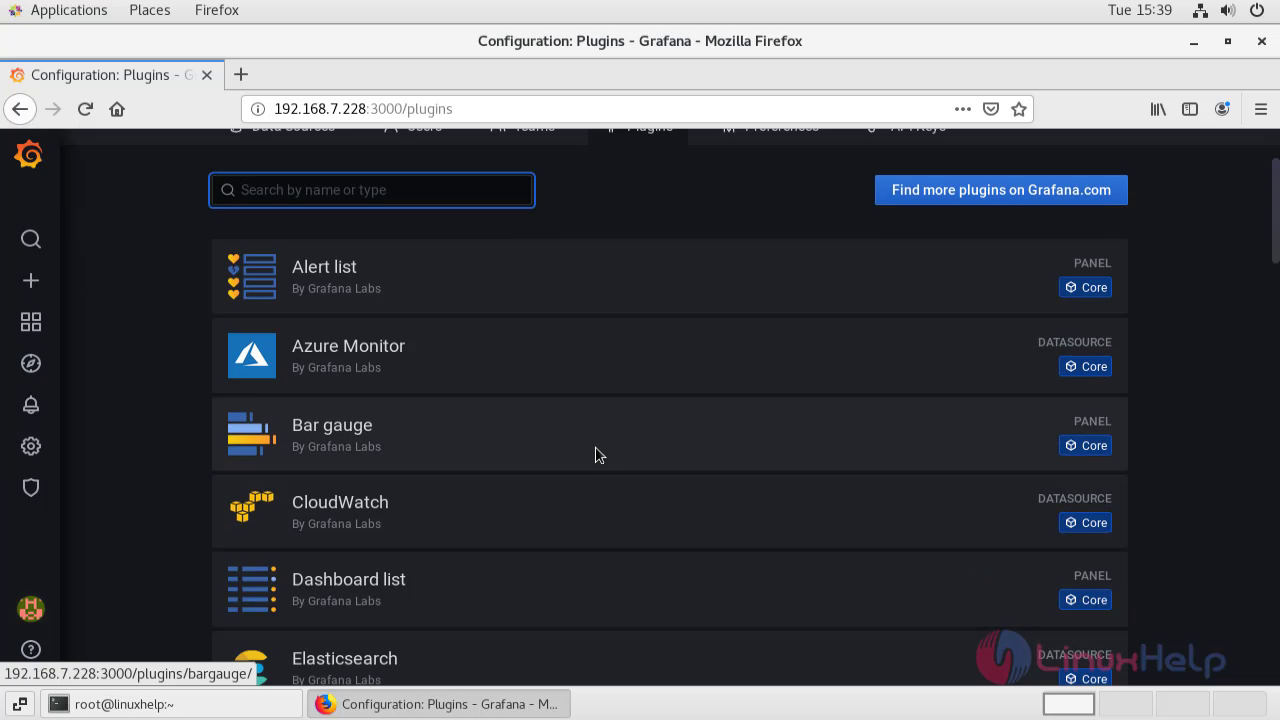
 This the option to add pulings in Grafana
With this the installation of Grafana on CentOS 7.6 comes to end.
Comments ( 0 )
No comments available