• Categories
    Category
    {{ postCtrl.tags }}
    • {{ category.tag_type }}

      • {{tag.tag_name}}
      • View more
  • Categories
    Category
    {{ postCtrl.tags }}
    • {{ category.tag_type }}

      • {{tag.tag_name}}
      • View more
  • News
  • Tutorials
  • Forums
  • Tags
  • Users
Tutorial News Comments FAQ Related Articles

How to Install Grafana on CentOS 6

{{postValue.id}}

To Install Grafana on CentOS 6

Grafana is open source data visualization and tracking suite. It supports databases such as Graphite, Elasticsearch, Included, Prometheus etc. The application have a metric analytics, with capability to control and create your own dashboard to your own apps or infrastructure performance monitoring. This tutorial covers the method to install Grafana on CentOS 6.

Installing Grafana

In order to install Grafana, you need to create a repo file in yum.repos.d location. Run the following command that creates the file.

[root@linuxhelp Desktop]# vim /etc/yum.repos.d/grafana.repo

And in that file, you should add the following lines to it.

[grafana]
name=grafana
baseurl=https://packagecloud.io/grafana/stable/el/6/$basearch
repo_gpgcheck=1
enabled=1
gpgcheck=1
gpgkey=https://packagecloud.io/gpg.key https://grafanarel.s3.amazonaws.com/RPM-GPG-KEY-grafana
sslverify=1
sslcacert=/etc/pki/tls/certs/ca-bundle.crt

Once the repo is created, you shall proceed with the installation process of Grafana by running the following command which triggers the installation process.

root@linuxhelp Desktop]# yum install grafana -y
Freeing read locks for locker 0x5: 3598/140639465715456
Freeing read locks for locker 0x7: 3598/140639465715456
Loaded plugins: fastestmirror, refresh-packagekit, security
Setting up Install Process
Loading mirror speeds from cached hostfile
 * base: mirrors.vonline.vn
 * extras: mirrors.vonline.vn
 * updates: mirrors.vonline.vn
grafana/signature                                        |  836 B     00:00    
Retrieving key from https://packagecloud.io/gpg.key
Importing GPG key 0xD59097AB:
 Userid: " packagecloud ops (production key) < ops@packagecloud.io> " 
From  : https://packagecloud.io/gpg.key
Retrieving key from https://grafanarel.s3.amazonaws.com/RPM-GPG-KEY-grafana
.
.
.
Running Transaction
  Installing : grafana-4.6.2-1.x86_64                                       1/1
### NOT starting grafana-server by default on bootup, please execute
 sudo /sbin/chkconfig --add grafana-server
### In order to start grafana-server, execute
 sudo service grafana-server start
POSTTRANS: Running script
  Verifying  : grafana-4.6.2-1.x86_64                                       1/1

Installed:
  grafana.x86_64 0:4.6.2-1                                                     

Complete!

Grafana has been installed, but it doesn’ t get over with this, as you need to start and enable the Grafana service. So, start the Grafana service by running the following command.

[root@linuxhelp Desktop]# service grafana-server start
Starting Grafana Server: ...                               [  OK  ]

And, enable the service by making use of the following command.

[root@linuxhelp Desktop]# service grafana-server enable
Usage: /etc/init.d/grafana-server {start|stop|restart|force-reload|status}

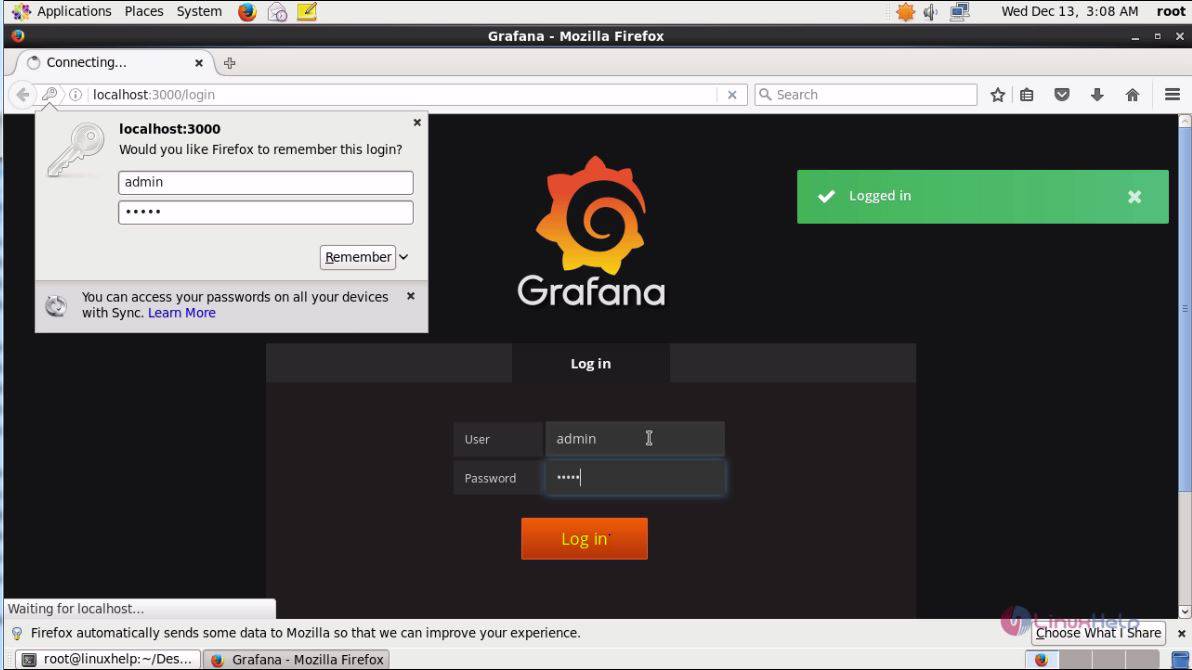
Now, we open your browser and give as http://localhost:3000 as your URL. The login page of Grafana appears on the screen. Enter admin in the both username and password fields. Click on the login button to proceed to the next page

LOGIN

Once you have logged in, you will be taken to the dashboard page of Grafana.

HOME

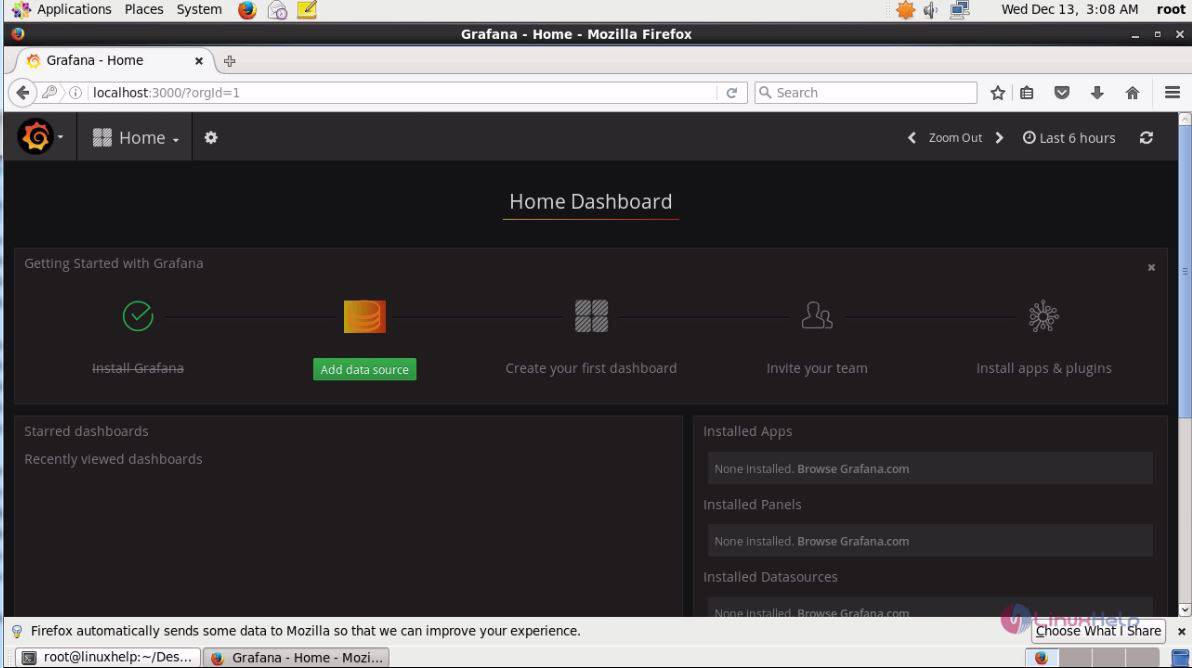
With this, the installation of Grafana comes to an end.

Tags:
jackson
Author: 

Comments ( 0 )

No comments available

Add a comment
{{postCtrl.cmtErrMsg}}

Frequently asked questions ( 5 )

Q

How do I use the second y axis? secondYAxis function does not work

A

You can switch any series to the second y axis by clicking on the colored line to left of the series name in the legend below the graph. Alternately, use the "Display Styles" > "Series Specif

Q

How do I exit graph edit mode?

A

Hit the escape key or click the graph title and select edit again.

Q

What is Grafana on CentOS?

A

Grafana is open source data visualization and tracking suite. It supports databases such as Graphite, Elasticsearch, Included, Prometheus etc. The application has a metric analytics, with the capability to control and create your own dashboard to your own apps or infrastructure performance monitoring.

Q

How do i reset admin password?

A

There is sadly not built in way to easily do this. The below instructions should work for sqlite3. If you use MySQL or Postgres the SQL command should also work. $ sudo sqlite3 /var/lib/grafa

Q

How to Install Grafana on CentOS?

A

Runt the following command:
# yum install grafana

Back To Top!
Rank
User
Points

Top Contributers

userNamenaveelansari
135850

Top Contributers

userNameayanbhatti
92510

Top Contributers

userNamehamzaahmed
32150

Top Contributers

1
userNamelinuxhelp
31040

Top Contributers

userNamemuhammadali
24500
Can you help legeek ?
Installation of the call center module

hello

I wish to install a call center in virtual with issabel, I downloaded the latest version of it , but I don' t arrive to install the call center module in issabel. please help me

thanks!

Networking
  • Routing
  • trunk
  • Netmask
  • Packet Capture
  • domain
  • HTTP Proxy
Server Setup
  • NFS
  • KVM
  • Memory
  • Sendmail
  • WebDAV
  • LXC
Shell Commands
  • Cloud commander
  • Command line archive tools
  • last command
  • Shell
  • terminal
  • Throttle
Desktop Application
  • Linux app
  • Pithos
  • Retrospect
  • Scribe
  • TortoiseHg
  • 4Images
Monitoring Tool
  • Monit
  • Apache Server Monitoring
  • EtherApe 
  • Arpwatch Tool
  • Auditd
  • Barman
Web Application
  • Nutch
  • Amazon VPC
  • FarmWarDeployer
  • Rukovoditel
  • Mirror site
  • Chef
Contact Us | Terms of Use| Privacy Policy| Disclaimer
© 2025 LinuxHelp.com All rights reserved. Linux™ is the registered trademark of Linus Torvalds. This site is not affiliated with linus torvalds in any way.