How to configure Apache plugins in Nagios Server
How to configure Apache plugins in Nagios Server
The Apache plugins in Nagios Server are apacherequests.pl and apachestatus.pl. The apacherequests.pl is based on the information provided by mod_status Apache module, so the plugin doesn' t require being executed on the server side. And the apachestatus.pl is a Nagios plugin that parses the status page of an Apache server and returns the response time, idle time and open slots. This tutorial will explain the configuration procedure of Apache plugins in Nagios Server to monitor Apache service status.
To know more about the installation procedure of Nagios core 4.3.2 on CentOS 6, visit
https://www.linuxhelp.com/how-to-install-nagios-core-4-3-2-on-centos/
Configuration procedure
To start the configuration procedure, first download the Apache plugins check_apacherequests.pl and check_apachestatus.pl from Nagios official site and move that into following location.
[root@server1 ~]# cp check_apacherequests.pl  check_apachestatus.pl  /usr/local/nagios/libexec/
[root@server1 ~]# cp check_apacherequests.pl  check_apachestatus.pl   /usr/lib64/nagios/plugins/
Now open the Nagios client configuration file and enter the following apache service configuration lines in the file. Save and exit from the file.
[root@server1 ~]# vim /usr/local/nagios/etc/servers/client.cfg
define service {
        use                             generic-service
        host_name                       192.168.7.13
        service_description             Apache-Requests
        check_command                   check_apacherequests.pl!5!10
}

define service{
        use                             generic-service           Name of service template to use
        host_name                       192.168.7.13
        service_description             HTTP_status
        check_command                   check_apachestatus.pl!
        }
Create the commands in the command.cfg configuration file to execute Apache plugins using the vim editor. Save and exit from the file.
[root@server1 ~]# vim /usr/local/nagios/etc/objects/commands.cfg
define command{
        command_name    check_apachestatus.pl
        command_line    $USER1$/check_apachestatus.pl -H $HOSTADDRESS$
}

define command{
        command_name    check_apacherequests.pl
        command_line    $USER1$/check_apacherequests.pl -w " $ARG1$"  -c " $ARG2$"
}
Change the ownership and permission for the two Apache plugins from the following location by using the cd command.
[root@server1 ~]# cd /usr/local/nagios/libexec/

[root@server1 libexec]# chown -R nagios.nagios check_apachestatus.pl check_apacherequests.pl
[root@server1 libexec]# chmod -R 775 nagios.nagios check_apachestatus.pl check_apacherequests.pl

[root@server1 ~]# cd /usr/lib64/nagios/plugins

[root@server1 libexec]# chown -R nagios.nagios check_apachestatus.pl check_apacherequests.pl
[root@server1 libexec]# chmod -R 775 nagios.nagios check_apachestatus.pl check_apacherequests.pl
Check the Nagios configuration status by executing the following command.
[root@server1 ~]# /usr/local/nagios/bin/nagios -v /usr/local/nagios/etc/nagios.cfg
Nagios Core 4.0.8
Copyright (c) 2009-present Nagios Core Development Team and Community Contributors
Copyright (c) 1999-2009 Ethan Galstad
Last Modified: 08-12-2014
License: GPL
Website: http://www.nagios.org
Reading configuration data...
   Read main config file okay...
   Read object config files okay...
Running pre-flight check on configuration data...
Checking objects...
        Checked 30 services.
        Checked 3 hosts.
        Checked 1 host groups.
        Checked 0 service groups.
        Checked 1 contacts.
        Checked 1 contact groups.
        Checked 30 commands.
        Checked 5 time periods.
        Checked 0 host escalations.
        Checked 0 service escalations.
Checking for circular paths...
        Checked 3 hosts
        Checked 0 service dependencies
        Checked 0 host dependencies
        Checked 5 timeperiods
Checking global event handlers...
Checking obsessive compulsive processor commands...
Checking misc settings...
Total Warnings: 0
Total Errors:   0
Things look okay - No serious problems were detected during the pre-flight check
Now restart the Nagios service by running the restart command.
[root@server1 ~]# systemctl restart Nagios
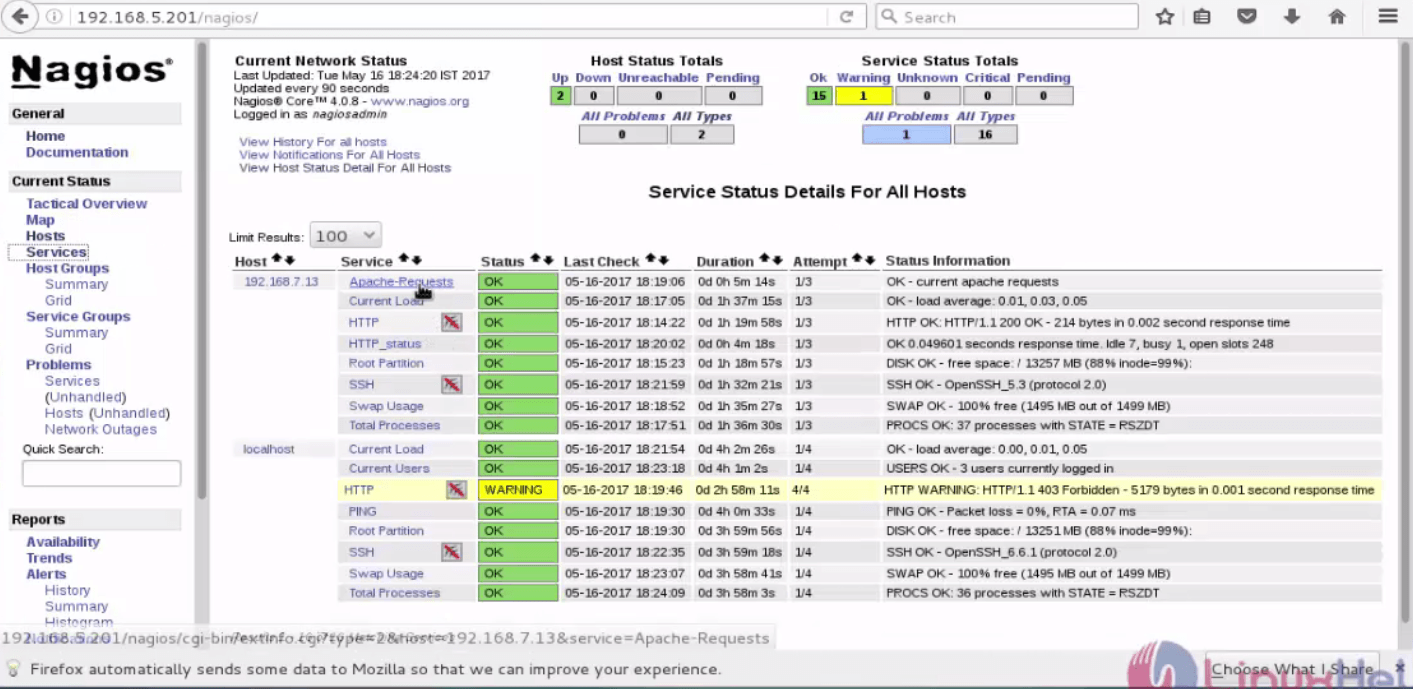
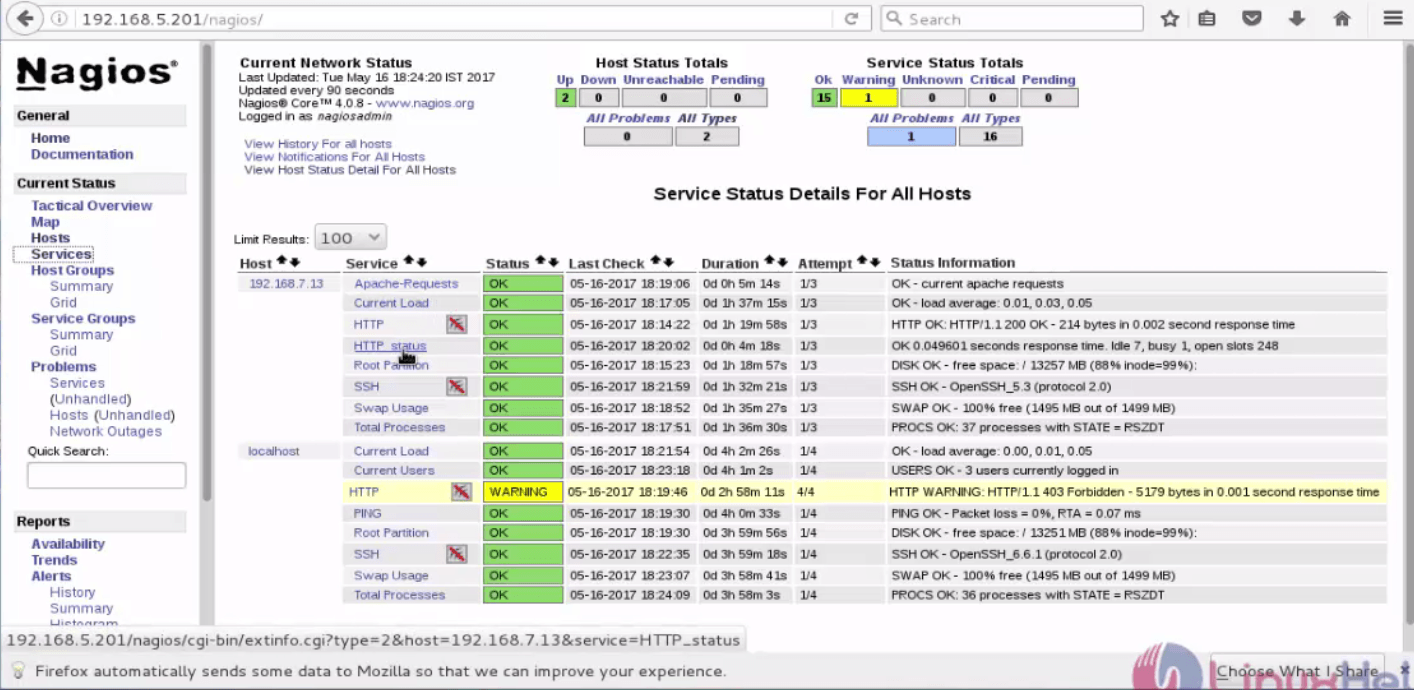
Open the browser and login into Nagios server and now the two installed Apache plugins are active as shown below.


Also the user can check the two plugins status from Nagios server from the command prompt. Go to the following location and execute the following command.
To check Apache status
[root@server1 ~]# cd /usr/local/nagios/libexec/
[root@server1 ~]# ./check_apachestatus.pl -H 192.168.5.201

OK 0.056174 seconds response time. Idle 9, busy 1, open slots 246 | 9 0 0 1 0 0 0 0 0 0 246
To check Apache Request
[root@server1 ~]# cd /usr/local/nagios/libexec/
[root@server1 ~]# ./check_apacherequests.pl -w 10 -c 9

OK - 1 current apache requests | ' apache requests' =1 10 9
Wasn' t that an easy configuration procedure? Stay connected to know more about Apache Nagios in the upcoming article.
Comments ( 0 )
No comments available